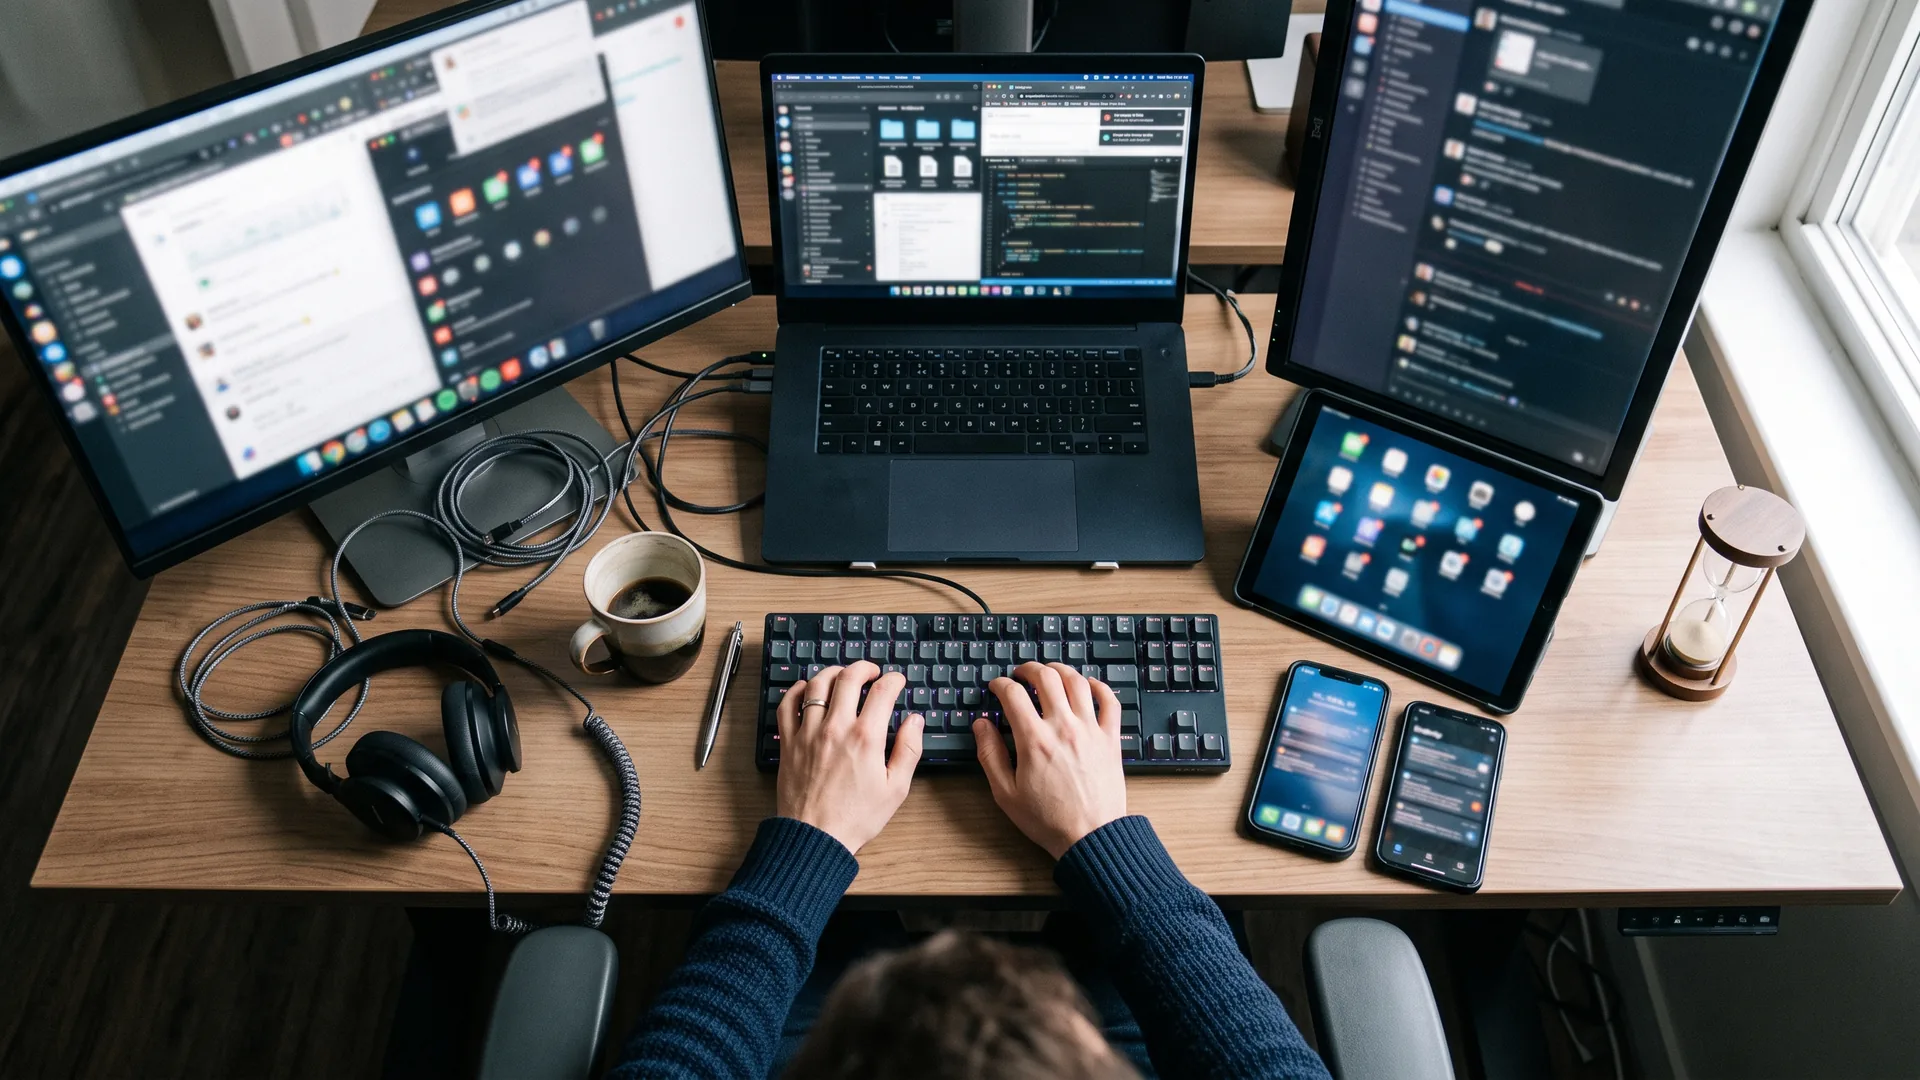
The most telling number about modern knowledge work comes from a company that sells the tools to watch it. ActivTrak's 2026 benchmark reports that the average focus session has fallen to 13 minutes 7 seconds, and focus efficiency, the share of time spent in uninterrupted work, has dropped to 60%, a three-year low. Over the same period collaboration time rose 34% and reported productive hours went up 5%.1 The paradox is the story. The metrics most platforms call productivity are improving while the thing that actually produces good work, sustained focus, is quietly collapsing.
The mechanism is tool sprawl. The average knowledge worker now runs 18 apps a day, with some roles reaching 23 to 36, and switches between apps and websites roughly 1,200 times daily, losing close to four hours a week, about 9% of working time, to context switching.2 A study of 3,000 remote knowledge workers run with Cornell's Ellis Idea Lab found workers waste around 59 minutes a day simply searching for information across tools, and 45% said the constant back-and-forth makes them less productive.3 This is a measurement gap, not an argument against software. Nobody chose to spend a fifth of the week reorienting.
The cost is cognitive, not just lost minutes
Time is the easy part to count. The harder cost is what switching does to the quality of the next hour. Peer-reviewed research on attention residue shows that when people switch tasks, part of their attention stays with the prior one, leaving fewer cognitive resources for what comes next, and the effect is worse when the earlier task was unfinished or under time pressure.4 The phenomenon is well-established: the brain pays a measurable switching cost in both time and accuracy each time it changes task, and those costs compound across frequent shifts.5 Gloria Mark's controlled experiment adds the wellbeing dimension: interrupted work gets completed faster, but at significantly higher stress, frustration and effort.6 Fragmentation does not just lose minutes. It taxes the person.
A data-literate reader should be wary here, because this territory is thick with laundered statistics. The two figures quoted most often, '23 minutes to refocus' and a '47-second attention span', are routinely misattributed, stripped of their caveats and recycled by tools that profit from the alarm.7 Mark's actual experiment never claimed 23 minutes to get back into flow, and the round numbers are averages across very different conditions.6 The honest position is the stronger one: the underlying effect is replicated and real even where the viral numbers are not, so the right move is to measure your own organisation's fragmentation rather than import someone else's headline.
Why activity monitoring rewards the problem
Conventional activity monitoring cannot see any of this, and the reason is structural. It counts active hours, app usage and keystrokes as productivity, so it treats a frantic morning of fifty app switches as a more productive one than two hours of unbroken concentration. High activity reads as high productivity precisely when focus efficiency is at its floor.1 The tool measures the symptom, active time, and is blind to the cause, tool-induced switching.
The irony is hard to miss. The same category of vendor now surfacing the focus-erosion data measures the activity its own model rewards, not the fragmentation that data describes. The friction is already visible in signals organisations hold: active tool count per user, message volume, meeting hours, after-hours activity and duplicate artefacts.8 What is missing is not the data. It is a measurement model that treats sustained focus, rather than raw motion, as the thing worth protecting.
Three signals worth measuring instead
A practical alternative does not require a new surveillance deployment, only a sharper choice of what to count. Three signals measure fragmentation directly. Focus-session duration tracks whether concentration windows are holding or shrinking. Then there is tool-switch velocity, or active tool count per user, which captures the sprawl itself. And a collaboration-to-creation ratio shows whether a team's day is going into making things or into talking about making them, read against the timing of interruptions during peak cognitive hours.8 All three read the cause, not the residue of motion the activity model mistakes for output.1
The difference that matters is who sees the signal first. When focus fragmentation surfaces on-device, to the employee, with consent flowing upward by choice, the worker who can see their own scattered morning tends to become an advocate for better meeting and tool hygiene rather than a subject of yet another monitoring layer. That is the opposite of the defensiveness top-down dashboards provoke. So the question for any leadership team watching productive hours tick up while real work feels harder than ever: are you measuring the motion, or the focus that motion is costing you?
Footnotes
-
ActivTrak. (2026). 2026 state of the workplace: AI adoption and workforce performance benchmarks. ActivTrak. https://www.activtrak.com/blog/2026-state-of-the-workplace ↩ ↩2 ↩3
-
Bonassi, K. (2026, February 12). How many work tools are too many? 2026 data for global teams. Hubstaff. https://hubstaff.com/blog/how-many-work-tools-are-too-many ↩
-
Wiggers, K. (2021, July 27). Qatalog: Productivity software overload is killing workers' productivity. VentureBeat. https://venturebeat.com/business/qatalog-people-waste-59-minutes-every-day-trying-to-find-data-in-apps ↩
-
Leroy, S. (2009). Why is it so hard to do my work? The challenge of attention residue when switching between work tasks. Organizational Behavior and Human Decision Processes, 109(2), 168-181. https://www.uwb.edu/business/faculty/sophie-leroy/attention-residue ↩
-
American Psychological Association. (2006). Multitasking: Switching costs. APA. https://www.apa.org/topics/research/multitasking ↩
-
Mark, G., Gudith, D., & Klocke, U. (2008). The cost of interrupted work: More speed and stress. Proceedings of the SIGCHI Conference on Human Factors in Computing Systems (CHI '08), 107-110. https://ics.uci.edu/~gmark/chi08-mark.pdf ↩ ↩2
-
University of California. (2023, January 10). Can't pay attention? You're not alone. University of California. https://www.universityofcalifornia.edu/news/cant-pay-attention-youre-not-alone ↩
-
Rae, J. (2024, July 26). How collaboration overload is destroying productivity in enterprise teams. UC Today. https://www.uctoday.com/unified-communications/how-collaboration-overload-is-destroying-productivity-in-enterprise-teams/ ↩ ↩2